


PAGE INDEX
1GB RAID 5 Test Results
If you’ve got more than three HDD spindle to put in play, it makes sense to use one of the more advanced RAID configurations. RAID 5 is one of the most popular setups, primarily due to the balance it exhibits between capacity and redundancy. Not surprisingly, most NAS units that can support more than three HDDs also support RAID 5, so it makes sense to use it for test purposes. Most NAS products that can support RAID 5 go beyond the minimum number of drive bays, to a total of four, so that is the number of drives that I typically use to test with, even though I could get by with only three. I’m also showing results for several different NAS units with 10GbE interfaces, which really show the true capability of those models with this superior NAS interface.
The top three pairs of results in each of the RAID5 charts are the results for the models that have the option of one or more 10GbE interfaces. Normally, I arrange all the results in descending order, but with the mix of 8x HDD v. 4x HDD and GbE v. 10GbE, I thought it would be easier to understand this way. Plus, the unit that’s the subject of this review is the first pair of results, right on top where they’re easier to find. The fact is, these models would have ended up on top, anyway. All these results are based on a single workstation interfacing with the NAS, and the larger models in this group are designed to handle data requests from multiple servers at one time. That doesn’t invalidate these results, because it’s still important to know what level of performance is available for a single user, as well as the overall aggregate.
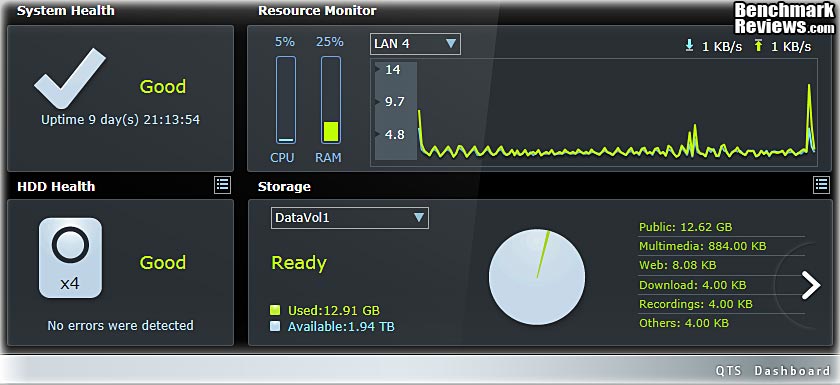
Before we look at the benchmark results, I want to show you the typical NAS CPU and Memory loading that occurred during these timed file transfer tests. As you can see, they are both quite low, and they stayed that way throughout the whole test. This chart is from a new widget that’s included in the QTS 4.0 application, which you can put on your desktop to monitor system resources, network activity, etc. The QFinder widget from version 3.8 is still there, and the old resource monitor screens are still available in the main software, and offer run charts instead of real-time “meters”.
Given all the behind-the-scenes processing that goes on to calculate parity bits for RAID 5, these results show that the QNAP TS-470 Turbo NAS has more than enough power under the hood to keep the drives performing at their highest potential during read operations. The TS-470 actually outperformed all of the other NAS systems, when set up with the 10GbE interface. There was also a huge difference in performance between the two 4-disk configurations, with the 10GbE results tripling the performance available with the GbE interface. CPU and memory utilization on the TS-470 were always quite low during READ tests. Read performance is clearly very strong with this system, which is a real bonus if you use it as frontline storage. Here we have network storage performance that’s on par with the local SSD in a high-end workstation. If you’re going to use it primarily as a backup system, you also want top-notch write performance, which we’ll test next.

The 1 GB RAID 5 disk write test shows very strong results, as well. Given the similar hardware specs between the TS-470 and the TS-870U-RP, I’m going to have to go back and retest the TS-870U-RP, after updating its firmware. There shouldn’t be this large of a performance gap. The performance scaling, as the NAS configuration went from GbE to 10GbE was similar for the TS-470 in both READ and WRITE tests, about 3:1. It’s well known that RAID 5 write performance can be a weak point, with all the computation overhead involved and the extra parity bits that need to be calculated and written to each of the drives. The only way to overcome that is with raw computational horsepower, and there may have been concerns that the Celeron CPU in the TS-470 wouldn’t be up to the task. These results clearly show that QNAP made wise choices when designing the TS-x70 platform. They picked the lowest cost CPU that would meet the performance requirements and keep up with the rest of the system. Between the two 8-bay NAS models, the EonNAS consistently did better in Write tests than Read, and it also turns in a top tier performance here. Both of the QNAPs had more balanced performance and usually were able to read data as fast as they could write it to disk.

Next up is 10 GB (1000 metric megabytes / 10,000,000,000 bytes) file transfer testing. Using the 4-disk RAID 5 configuration in each NAS, and a combination of 10GbE and single Gigabit connections, network throughput will be put to the test, and the effect of any system or hardware caches will be minimized. This is almost pure sequential disk access testing, combined with a real-world application that gets repeated millions of times a day – file transfer.
10GB RAID 5 Test Results
Looking at Read tests with a single 10GB file, the TS-470 keeps its top place in Read performance. The Read results with a single 10GB file are over 350 MB/s, which is the fastest performance of any other 4-bay system I’ve ever tested before. No worries about the budget CPU in the TS-x70 series not having enough performance, that’s for sure. The performance scaling was consistent again, as the number of disks increased and the network bandwidth opened up the bottleneck that we usually see when NAS units are constrained by their GbE connections. The bottom half of this chart is filled with excellent NAS products that could post much better numbers in this benchmark, if only they were equipped with better network interfaces.

Looking at write tests with a single 10GB file, the TS-470 comes out on top again, by a wide margin. I used to say that if you’re writing large files to a NAS, you can’t afford to scrimp on system hardware; you need the biggest, baddest CPU you can afford. This Celeron-based NAS has made me re-think that a bit, in favor of a more optimized systems approach. Clearly, the 10x improvement in network bandwidth that you get with 10GbE is a critical factor in getting the maximum available performance from a high-capacity NAS. There are a number of other elements that must actively support the system as well, like the Platform Hub Controller (nee Southbridge) and SATA-to-PCI interfaces. In addition, the Operating system has a big influence, as we’ve seen lately with a couple of NAS units that feature a Solaris based O/S. The TS-470 has just the right blend of internal components to maximize the performance v. cost equation. The lower cost of the tower configuration hardware, compared to the rack mount form factor, helps improve the cost-benefit ration even further.

All in all, after these series of file transfer benchmarks, I have to give a lot of credit to QNAP for delivering almost all of the performance of their high-end business class rack mount devices, in a lower cost tower format. The tagline for the TS-870U-RP model that Benchmark Reviews tested earlier this year was, “Economical, yet Powerful…”, but i think this new TS-x70 tower series is an even better bargain. This time I only had a 4-bay device on the test bench, so I can’t say for sure how the larger versions in this series perform, but I have no reason to doubt they will hold up under scrutiny.
If you combine this NAS with some of the new economical 10GbE switches, like the NETGEAR XS708E ProSafe Plus 10GbE Switch that was reviewed here in Benchmark Reviews, the potential is there to radically improve the productivity of the high-end workstation user, at a much lower cost than was recently possible. With such a wide performance envelope, it’s suited for any task you might think of: front-line storage, backup, replication, or any combination. Its iSCSI capability means you’re not limited to a single application, and the compatibility with multiple virtualized environments will be a big plus for corporate users.
Next, let’s take a look at test results from a benchmark suite that’s specifically designed to measure NAS performance, using test scenarios that cover a wide range of use cases. I’m talking about the NASPT tool from Intel.
NAS Comparison Products
- QNAP TS-870U-RP 8-bay SATA NAS Server
- EonNAS 1100 NAS Network Storage Server
- ASUSTOR AS-604T NAS Network Storage Server
- EonNAS 850X NAS Network Storage Server
- Thecus N5550 4-Bay SATA NAS Server
- Netgear ReadyNAS NV+ v2 4-bay SATA NAS Server
- QNAP TS-879U-RP 8-bay SATA NAS Server
- QNAP TS-219P+ 2-Bay SATA NAS server
- QNAP TS-259 Pro 2-Bay SATA NAS server
- QNAP TS-659 Pro II 6-Bay SATA NAS server
- QNAP TS-419P II 4-bay SATA NAS Server
Most Recent Comments